Plot Method for fdClass Objects
plot.fdClass.RdGenerates a line plot of the functional data stored in an object of class fdClass.
Usage
# S3 method for class 'fdClass'
plot(x, ...)Details
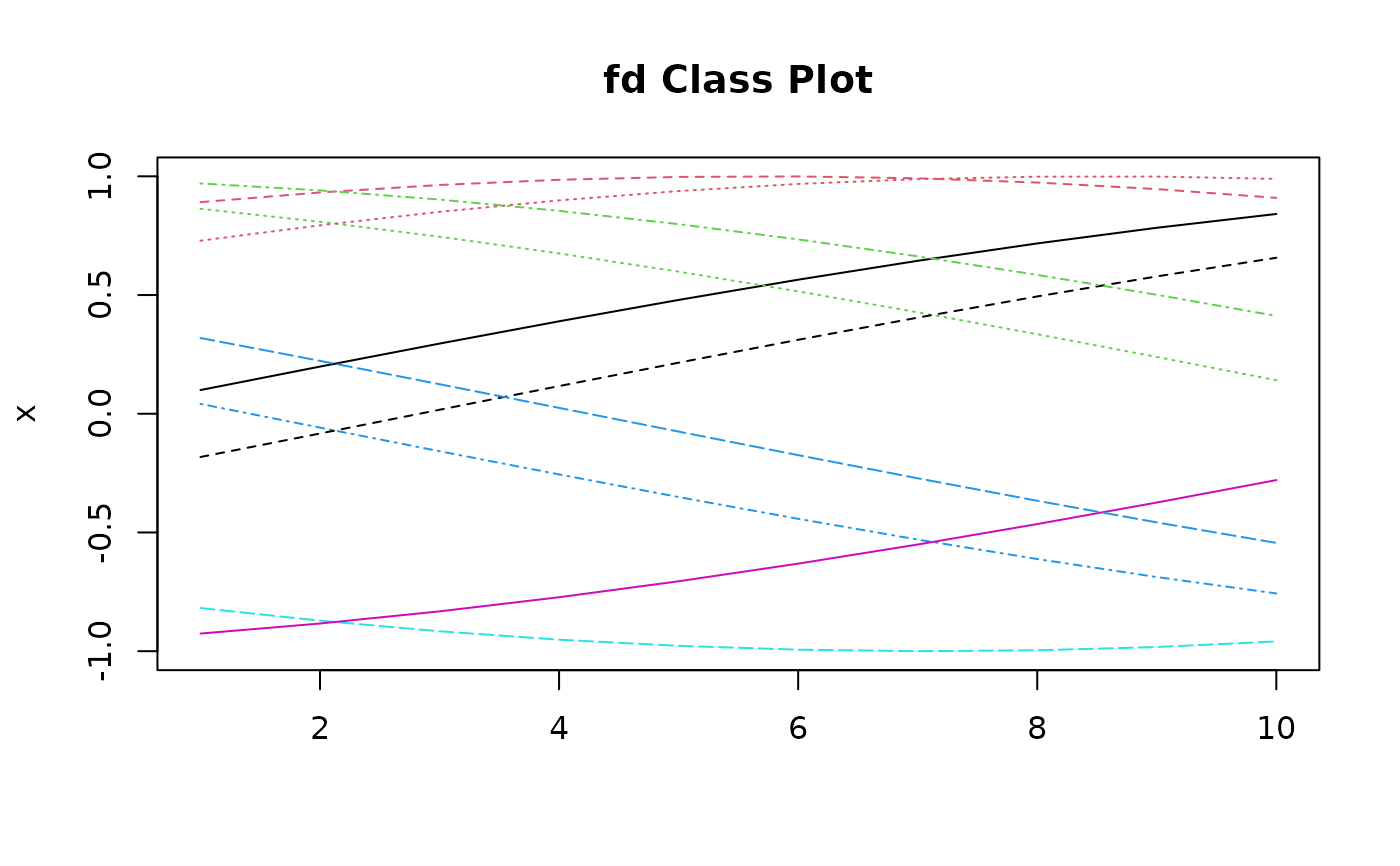
This function uses matplot to visualize each observation (row) as a separate curve.
It provides a quick overview of the functional data structure stored in the fdClass object.
Examples
fd_obj <- fdClass(matrix(sin(1:100 / 10), nrow = 10, ncol = 10))
plot(fd_obj)
#> Warning: There should be an equal number of grid points and columns. 'argval' is set to NULL!
#> Warning: There should be an equal number of grid points and columns. 'argval' is set to NULL!
#> Warning: There should be an equal number of grid points and columns. 'argval' is set to NULL!
#> Warning: There should be an equal number of grid points and columns. 'argval' is set to NULL!
#> Warning: There should be an equal number of grid points and columns. 'argval' is set to NULL!
#> Warning: There should be an equal number of grid points and columns. 'argval' is set to NULL!
#> Warning: There should be an equal number of grid points and columns. 'argval' is set to NULL!
#> Warning: There should be an equal number of grid points and columns. 'argval' is set to NULL!
#> Warning: There should be an equal number of grid points and columns. 'argval' is set to NULL!
#> Warning: There should be an equal number of grid points and columns. 'argval' is set to NULL!