Plot Method for hdClass Objects
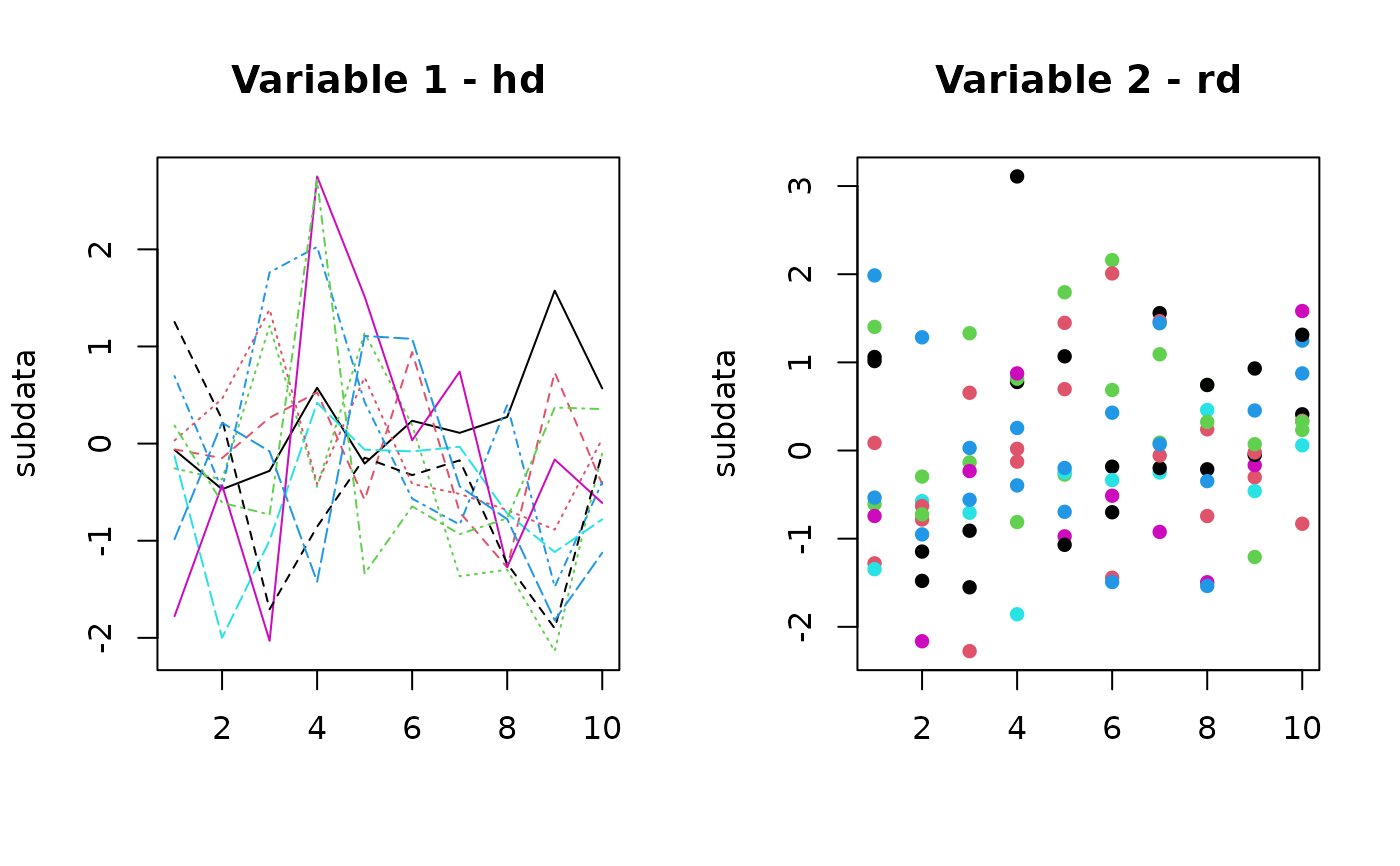
plot.hdClass.RdVisualizes each variable in a hybrid data object (hdClass) using an appropriate plot style:
Functional data are shown using lines (
matplot(..., type = "l")).Regular data are shown using solid dots (
matplot(..., type = "p", pch = 16)).Image data are plotted using
image()if they originated from matrices.
Usage
# S3 method for class 'hdClass'
plot(x, ...)