Plot Method for rdClass Objects
plot.rdClass.RdProduces a scatter plot of regular data stored in an rdClass object.
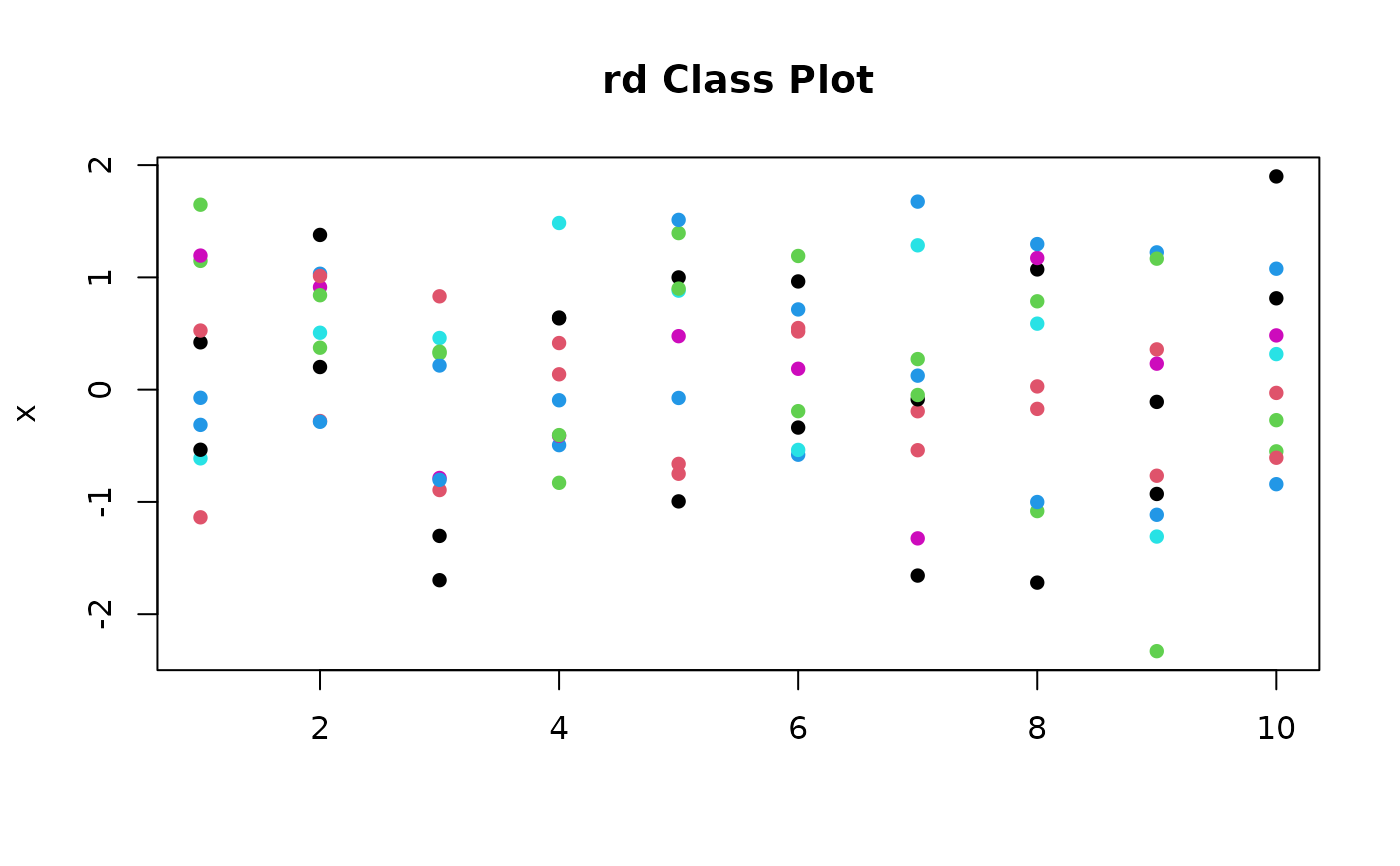
Each column is plotted as a sequence of solid points.
Usage
# S3 method for class 'rdClass'
plot(x, ...)plot.rdClass.RdProduces a scatter plot of regular data stored in an rdClass object.
Each column is plotted as a sequence of solid points.
# S3 method for class 'rdClass'
plot(x, ...)